共起ネットワークをnetworkxで。。。と調べている最中に非常に素晴らしく便利なライブラリを発見しましたので、早速使ってみました。
nlplotというPythonのライブラリです。
このライブラリを使うと以下のグラフを簡単にプロットできてしまいます。凄いです。
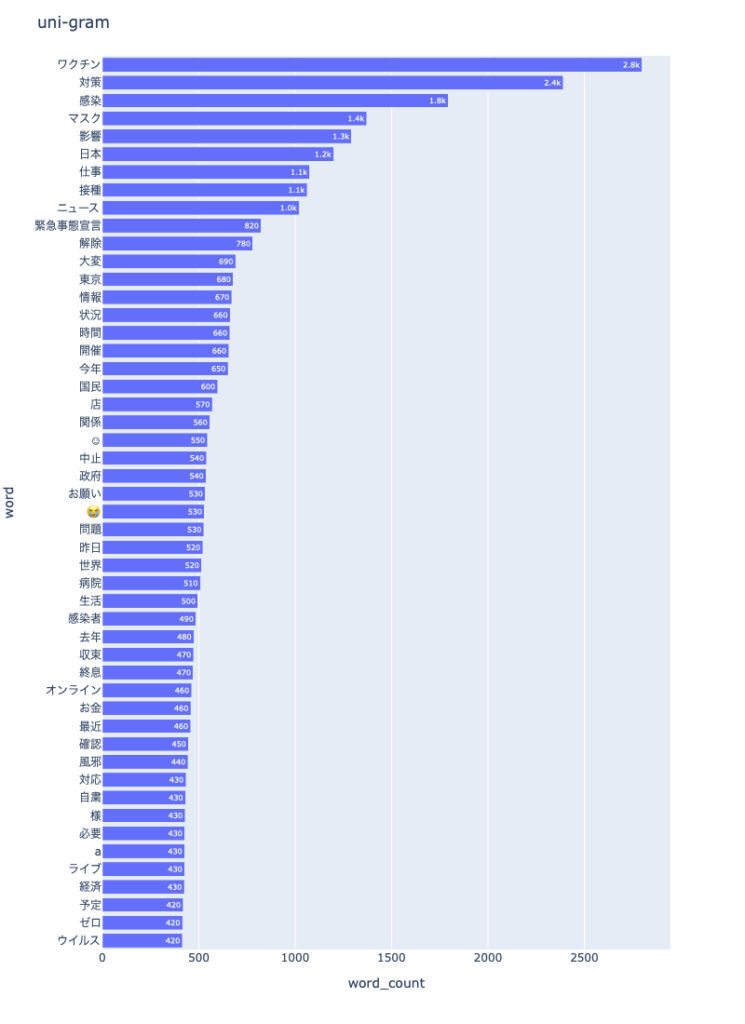
- N-gram bar chart
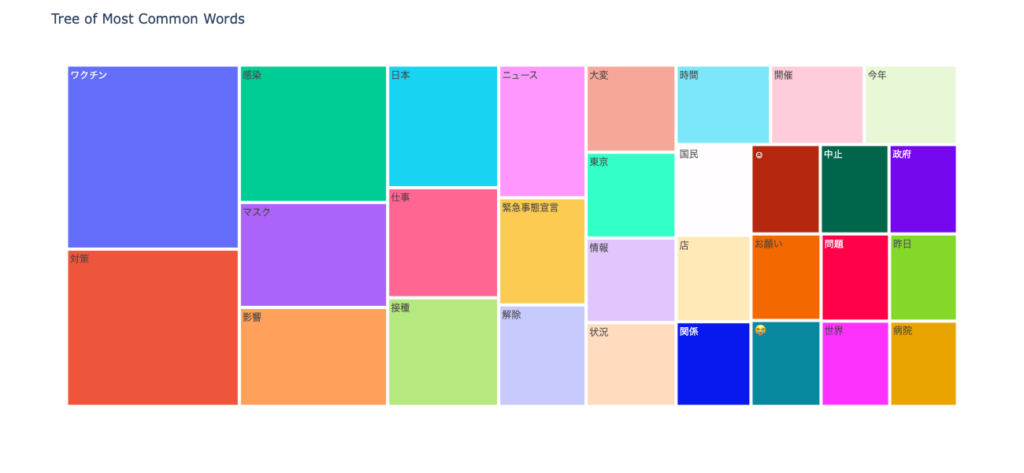
- N-gram tree Map
- Histogram of the word count
- wordcloud
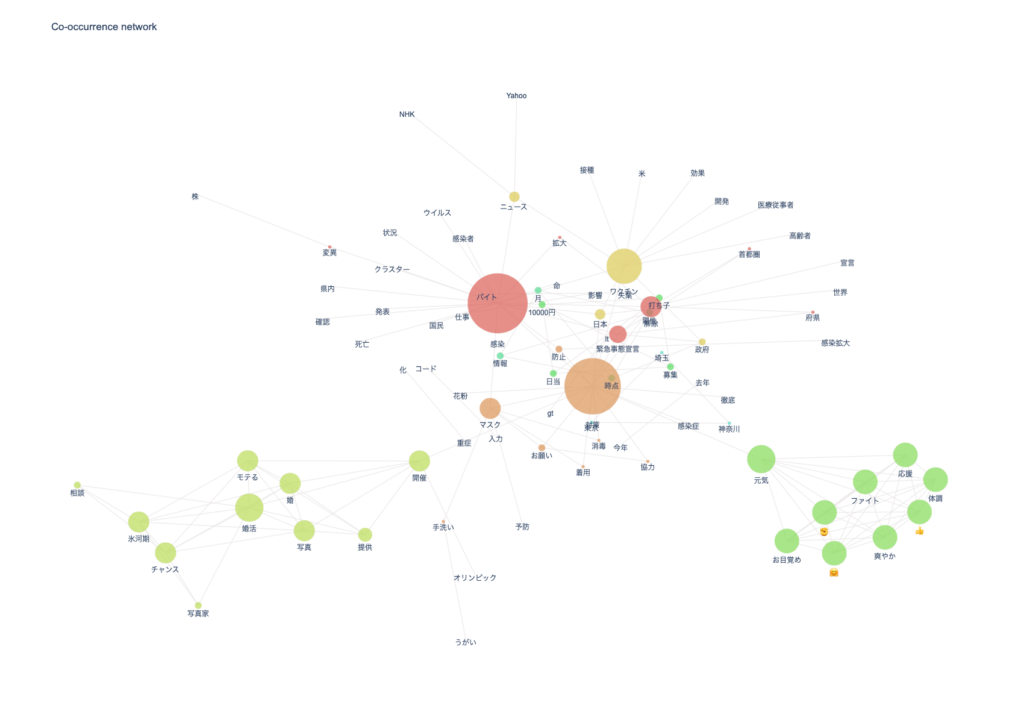
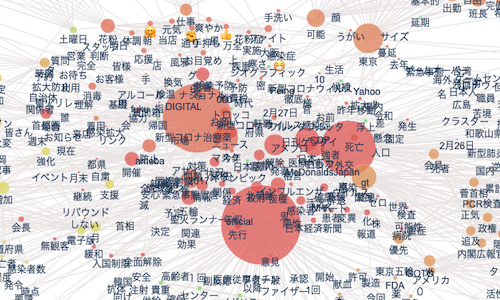
- co-occurrence networks
- sunburst chart
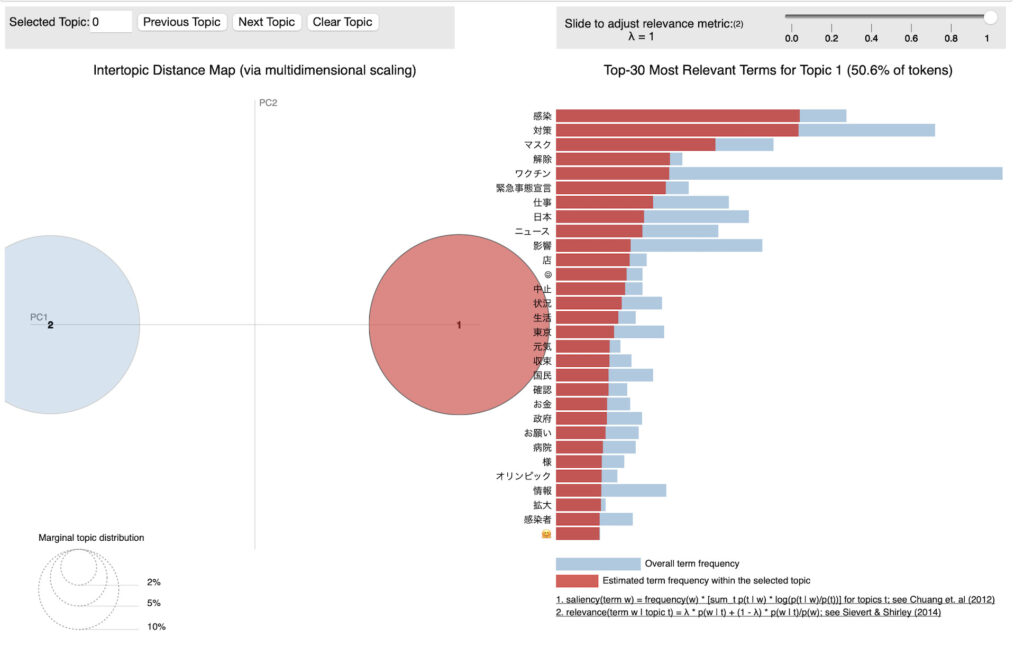
- pyLDAvis
Twitterで「コロナ」を使用したTweetsをnlplotでグラフ化
今回nlplotを使うにあたって、Twitterにて「コロナ」の文字が含まれるTweetsを取得しました。
TweetsデータはMongoDBに格納し、呼び出し、データフレーム化したのち、nlplotの一連のグラフ処理をいたしました。
MongoDBからコレクションを取得
import pymongo
from pymongo import MongoClient

#MongoDBに接続(コネクション:clientの作成)
client = pymongo.MongoClient('localhost', 27017)

#データベースsanmpleDBを取得する
db = client.boxcode

#コレクションtestを取得する
dbcol = db.test
MongoDBから取得した情報をデータフレーム化
import pandas as pd

#MongoDBから取得した情報をデータフレーム化
df = pd.DataFrame(list(dbcol.find()))

#リツィートされているものは除外
df1 = df[df['retweeted_status'].isnull()]

#text列のみ取得し、データフレームdf1にセット
df1 = df1.loc [:, ['text']]

#表示
df1
結果

MeCabで形態素解析(名詞のみを取得)
import MeCab

def mecab_text(text):

    #MeCabのインスタンスを作成(辞書はmecab-ipadic-neologdを使用)
    mecab = MeCab.Tagger('-d /usr/local/lib/mecab/dic/mecab-ipadic-neologd')

    #形態素解析
    node = mecab.parseToNode(text)

    #形態素解析した結果を格納するリスト
    wordlist = []

    while node:
        #名詞のみリストに格納する
        if node.feature.split(',')[0] == '名詞':
            wordlist.append(node.surface)
        #他の品詞を取得したければ、elifで追加する
        #elif node.feature.split(',')[0] == '形容詞':
        #    wordlist.append(node.surface)
        node = node.next
    return wordlist

#形態素結果をリスト化し、データフレームdf1に結果を列追加する
df1['words'] = df1['text'].apply(mecab_text)

#表示
df1
結果

nlplotを使ってみる
データの準備ができましたので、早速nlplotを使ってみます。
nlplotのインストール
pip install nlplotN-gram bar chart
コードは一部の引数のみ修正にとどまり、基本開発元のサイトのコードをそのまま使っています
import nlplot

npt = nlplot.NLPlot(df1, target_col='words')

# top_nで頻出上位単語, min_freqで頻出下位単語を指定できる
# ストップワーズは設定しませんでした。。。
stopwords = npt.get_stopword(top_n=0, min_freq=0)

npt.bar_ngram(
    title='uni-gram',
    xaxis_label='word_count',
    yaxis_label='word',
    ngram=1,
    top_n=50,
    stopwords=stopwords,
)
結果
N-gram tree Map
npt.treemap(
    title='Tree of Most Common Words',
    ngram=1,
    top_n=30,
    stopwords=stopwords,
)
結果
Histogram of the word count
# 単語数の分布
npt.word_distribution(
    title='number of words distribution',
    xaxis_label='count',
)
結果

wordcloud
npt.wordcloud(
    max_words=100,
    max_font_size=100,
    colormap='tab20_r',
    stopwords=stopwords,
)
結果

co-occurrence networks
# ビルド(データ件数によっては処理に時間を要します)※ノードの数のみ変更
npt.build_graph(stopwords=stopwords, min_edge_frequency=100)

display(
    npt.node_df.head(), npt.node_df.shape,
    npt.edge_df.head(), npt.edge_df.shape
)

npt.co_network(
    title='Co-occurrence network',
)
結果
sunburst chart
npt.sunburst(
    title='All sentiment sunburst chart',
    colorscale=True,
    color_continuous_scale='Oryel',
    width=800,
    height=600,
    save=True
)
結果

pyLDAvis
npt.ldavis(num_topics=2, passes=5, save=True)結果
一つ一つの処理をコードで書くと結構大変ですが、
こちらのnlplotを使いますと、それぞれのチャートやグラフをすぐに取得描画することができます。
膨大なデータから全体像を把握する上で、これほど素晴らしいライブラリはないですね。
今後も使わせていただきます。
それにしても、「コロナ」という単語から、なぜ?というTweetsが結構あることに気付かされました。
ちょっと継続的に調べてみます。
では。

いつも勉強させていただいております。
データマイニングに関心がありpythonの勉強を始めました
今回のサンプルコードを実行し、wordcloudは上手くいったのですが、co-occurrence networksの
npt.build_graph(stopwords=stopwords, min_edge_frequency=100)
の個所で
raise ValueError(ValueError: n_communities must be between 1 and 0. Got 1
とエラーが出てしまい、原因がわからず困っています。
アドバイスお願いします